Understanding The Market & Volume / News Trading
Success is based on knowledge, experience and psychology. Our education is based on the simple fundamentals that rule the financial market.
Understanding Market Structure
Anticipating future price action in the market is what traders are doing. Due to the nature of the market, this is simple. Predictions about what is going to happen next, in which direction the price of an instrument is going to move, are made using Technical Analysis.
Due to the psychological nature of human habits, beginner traders tend to gamble themselves into positions they don’t want to be in. Therefore, it is essential to learn and understand what is happening in the market, when and where retail traders are able to benefit from potential moves.
Building healthy trading habits is as important as understanding the financial market.
Trading is a task of probability and risk management. Therefore, success heavily relies on placing a trade correctly after applying Technical Analysis. Placing a trade correctly means entering a position in the best possible moment while risk management is held tight. We teach to execute trades when having the highest possible winning probabilities while minimizing risk. All executions must be based on the principles of confluence between higher and lower timeframes. Applied correctly, multiple timeframe analysis increases the probability of executing a winning trade enormously.
Every beginner must learn multiple timeframe analysis. The benefits from this technique is obvious. We want to eliminate losses. And in case these happen, risk management in form of a stop loss is held tight. Beginners are not skilled at reading all necessary information from a single higher timeframe straight away. Education and experience is necessary to understand Technical Analysis and apply it while the market is moving. Therefore, we do live sessions.
One of our main goals is to provide the skill set and strategies on how to avoid losses.
The following analysis is an example to show how simple & easy it gets to predict upcoming price action on the charts.
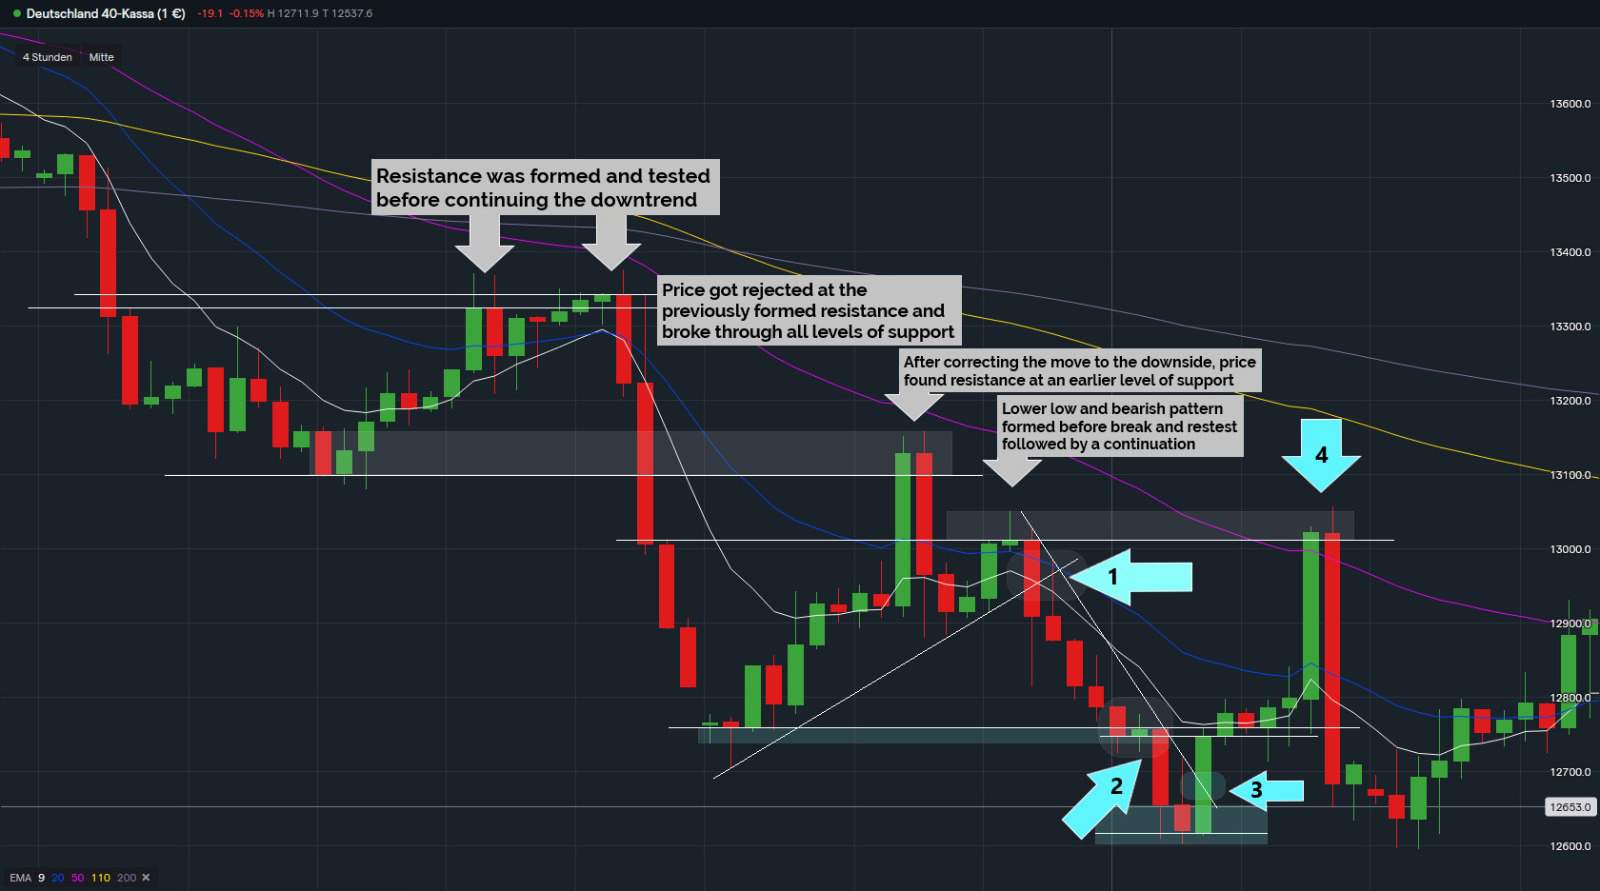
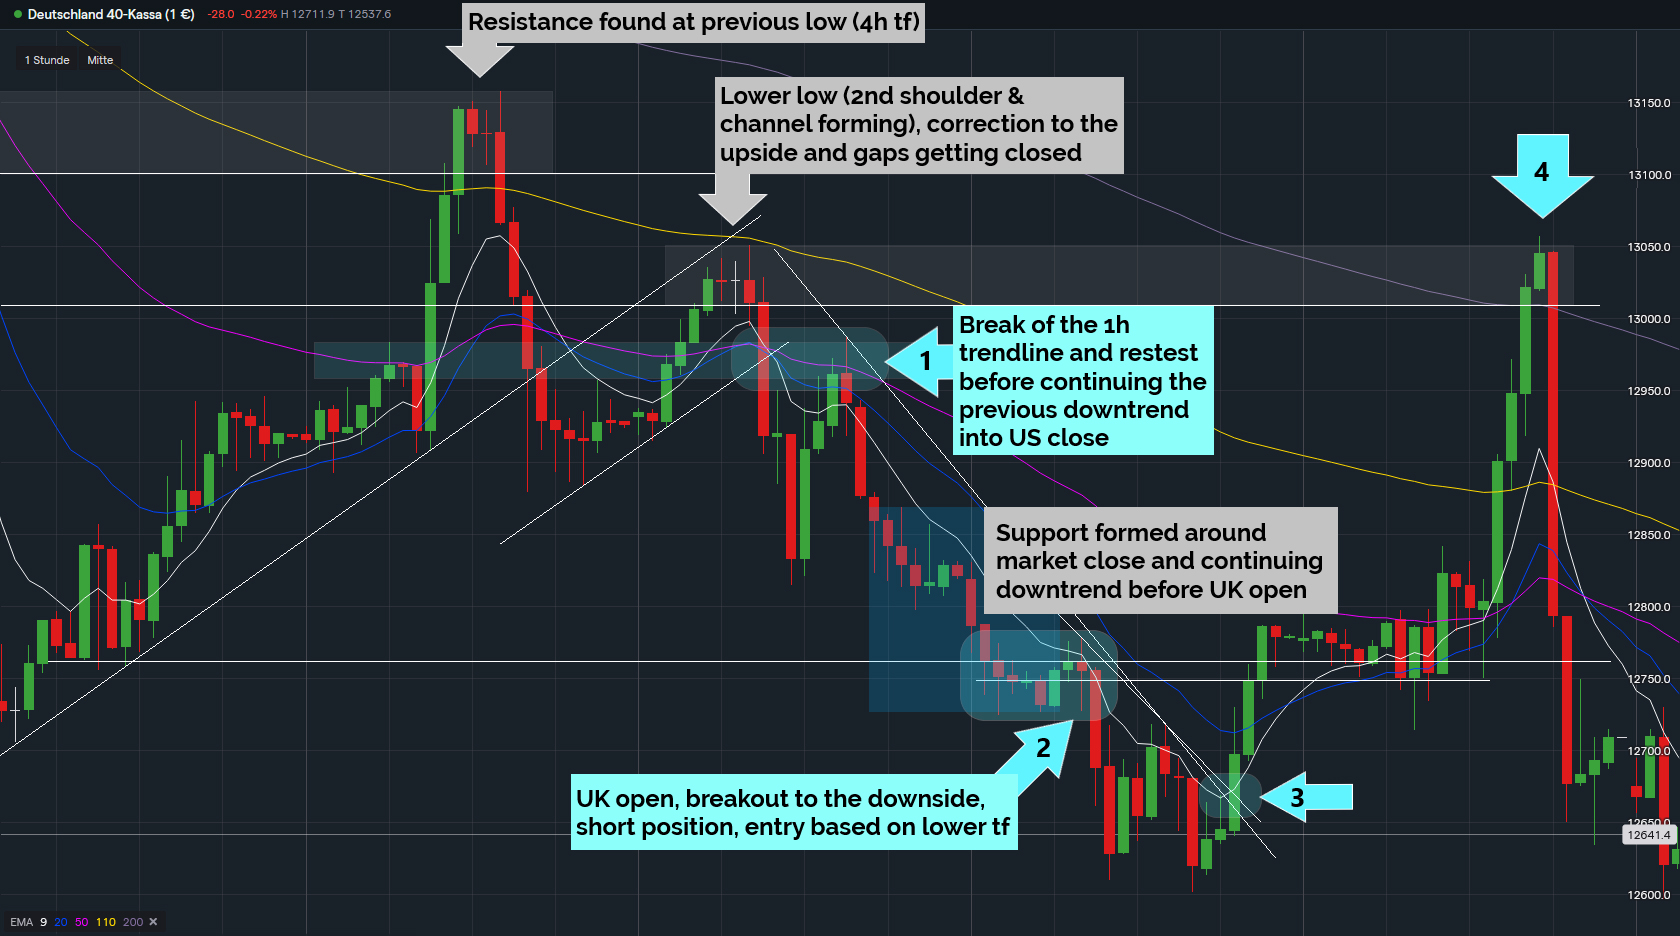
The higher timeframe charts (4h; picture no.1 & 1h; picture no.3 -the charts are displaying Germany40 - for explanation reasons; any stock, indice or fx-pair could have been used) give us a clear idea of what happened in the market recently. This is colloquial called, looking at the bigger picture.
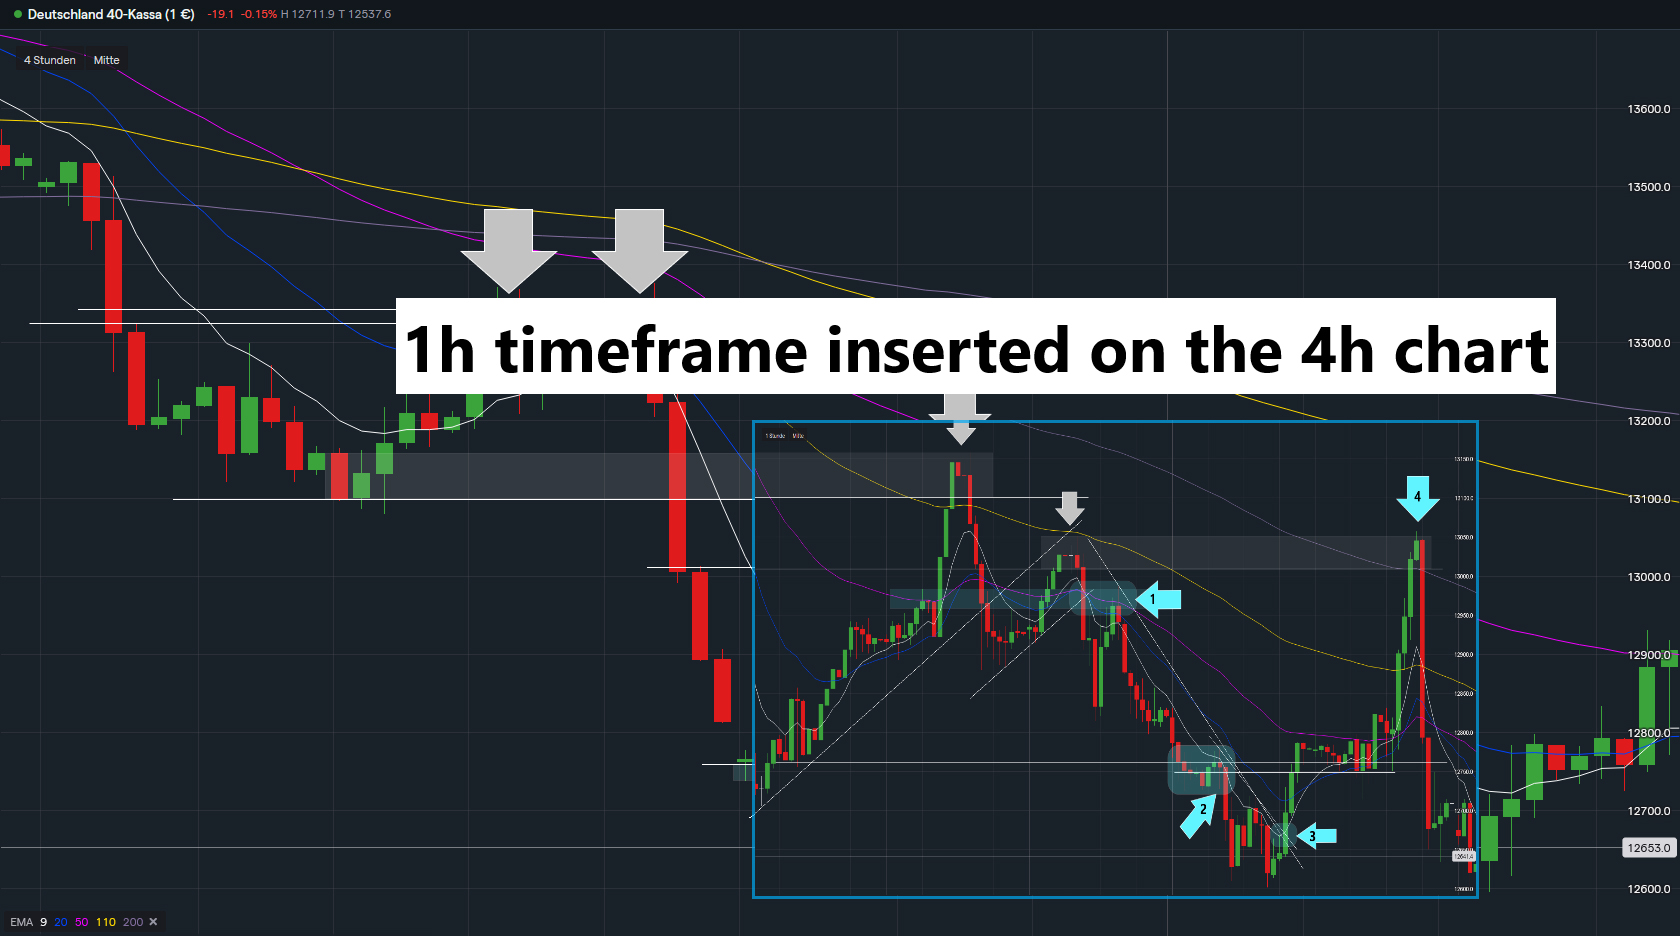
After placing the 1h chart correctly onto the 4h chart (picture no.2) each 4h candle is now displayed by four 1h candles - there is more information on the chart.
Once we had a look at the higher timeframe, we start looking at the lower timeframes. After identifying trend and sentiment on the 4h & 1h chart, the analysis continues on the 1h (and 30min & 15min) timeframe.
You’re getting an impression from the examples of what our education on Technical Analysis is about. We are identifying the trend and further predict upcoming price action. We look at confluences between different timeframes to get a clear indication of market structure and upcoming price action.
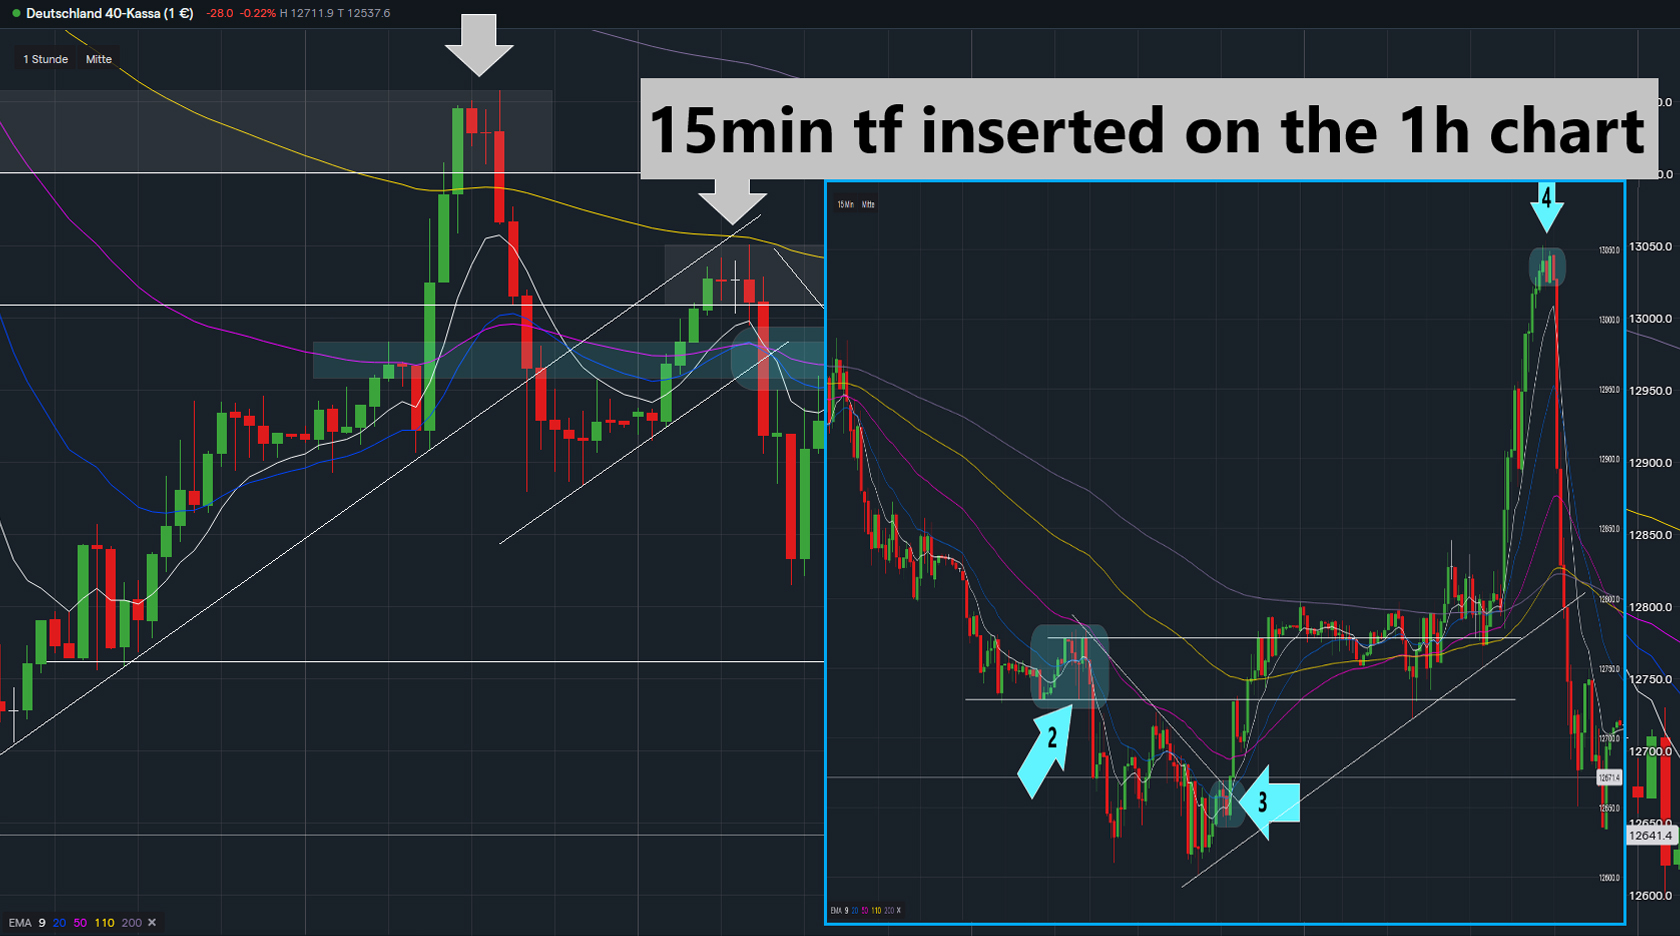
After placing the 15min timeframe onto the 1h chart (picture no.4), the chart becomes slightly confusing for beginners. There is a lot more information on the chart. Four 15min candles now represent one 1h candle.
Technical Analysis is a skill that is learnable. We prepared hundreds of exercises on Technical Analysis. Continuing the analysis lower than on the 15min timeframe gives the opportunity to sniper an entry. Doing this is part of the education and covered in great detail.
One main focus is to teach this to you. Reading the market and understanding candles. Multiple timeframe analysis eliminates most of the noise in the market. We teach you to execute on as many confirmations as possible. On both, higher and lower timeframes.
Be prepared to work hard when learning. Everything seems easy when talking about break & retest, fakeouts, impulsive and correction moves after price has already moved but it’s a different thing to spot it correctly while it’s actually happening. Therefore, we provide the live sessions for building confidence together with a reliable skill set.
Volume & News Trading
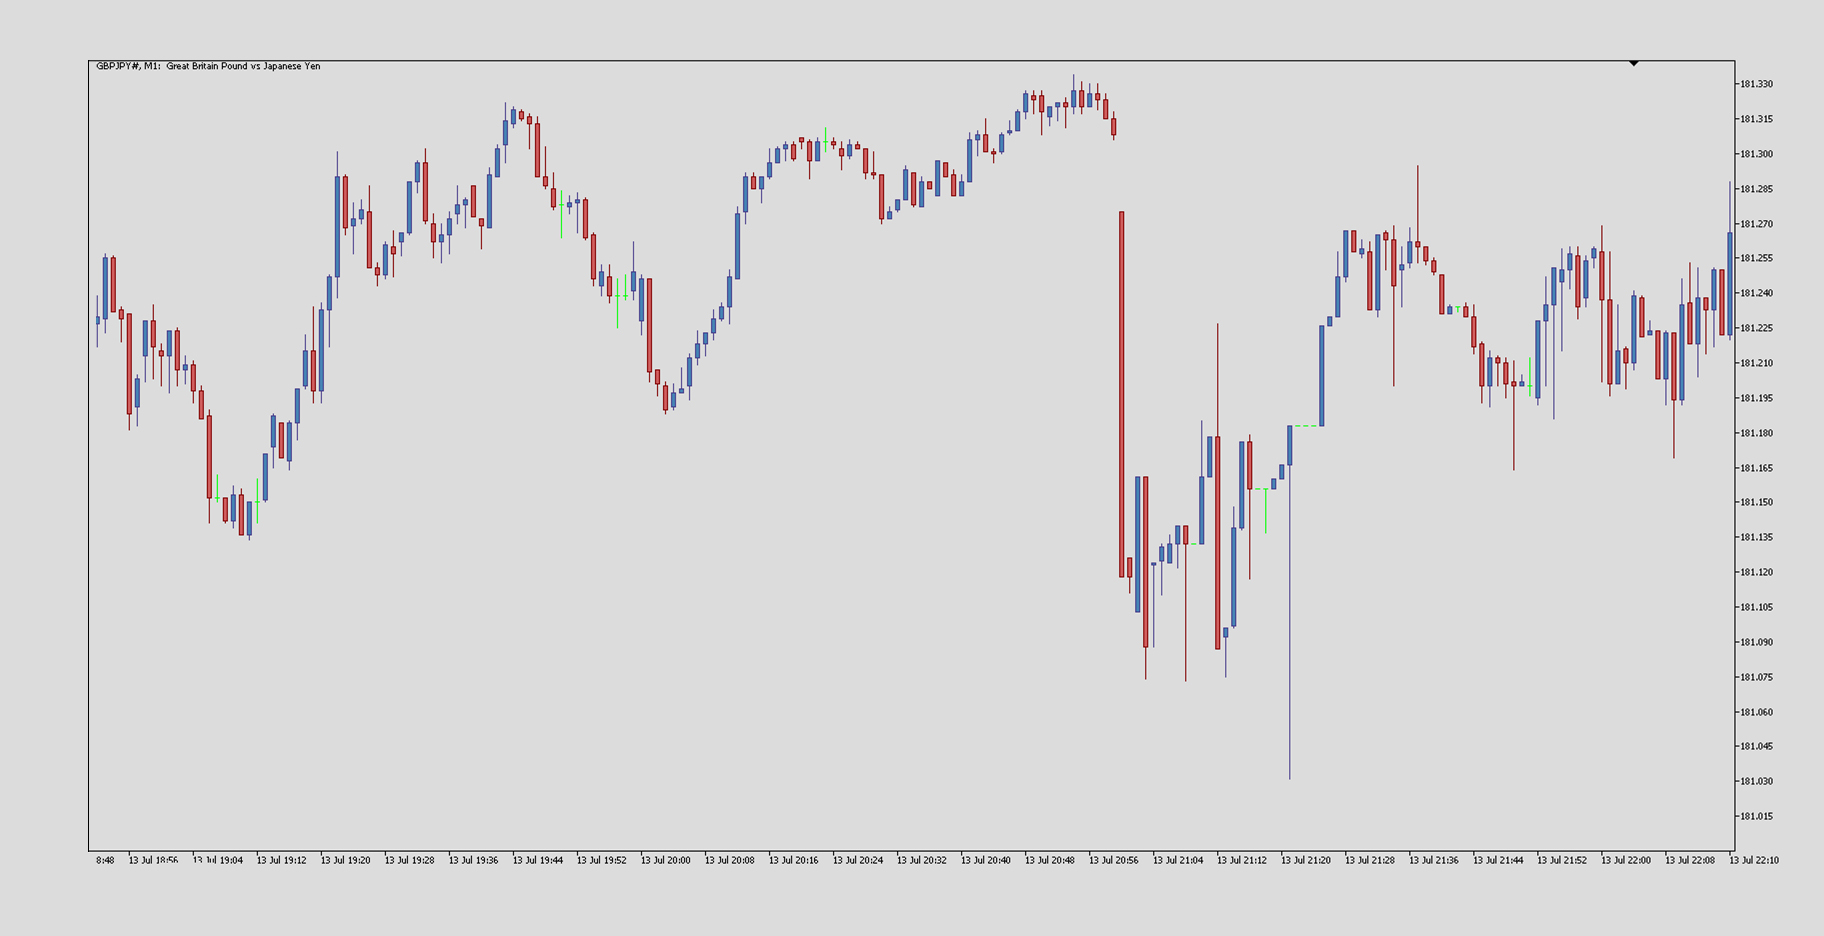
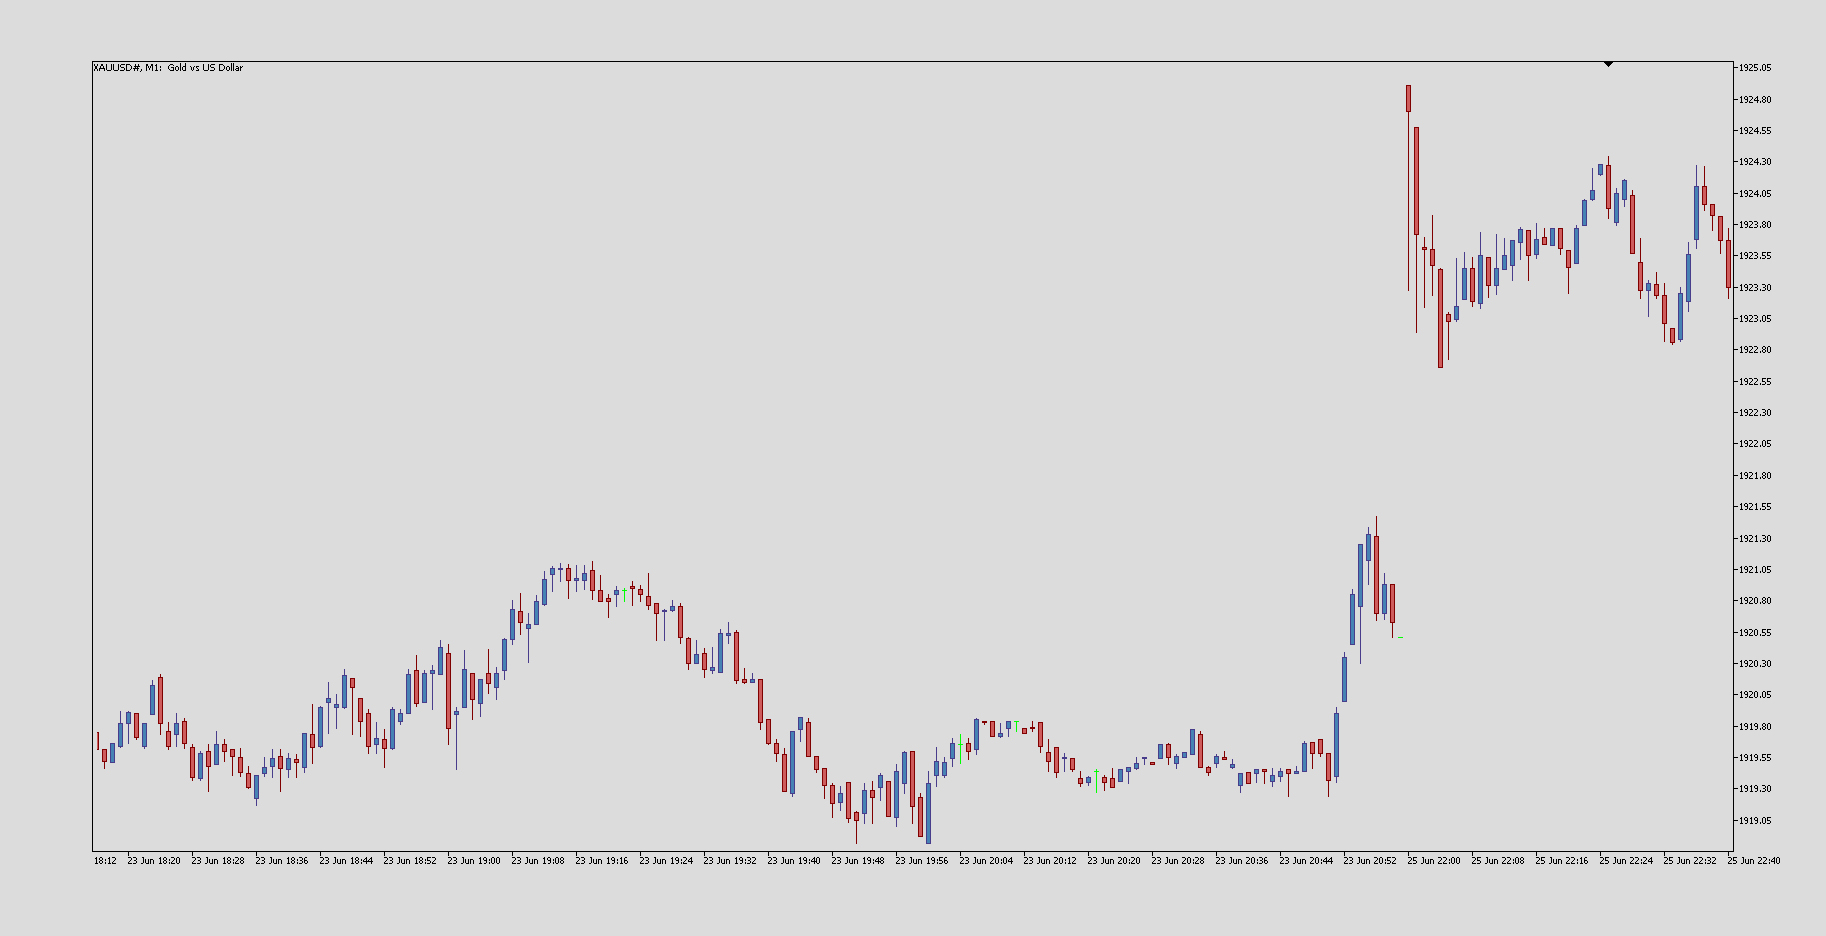
Trading news or trading volume related to news is a trading technique. It’s also called Volume Trading, which refers to open positions related to sudden volume moving the market which often leads to a high volatility. Whenever there is important data to be published, traders look for an opportunity to take a risk into making money, which is necessarily not a bad thing, but regarding the progress of becoming a consistent profitable trader - it’s not a good thing either. The news events with high volume like interest rates, CPI (consumer price index), jobless claims and so on all happen with a very high volume and bring volatility into the market. This makes it unnecessarily hard to predict or anticipate how price will move.
If you want to trade the volatility happening with the news as a beginner, you will try to do that by placing a market order. After placing your order and counting down into the event, tension will rise, straining you up wanting to either close the position in profit or near your stop loss if price comes closer to it (risk management). Once the news is released, the volume pumps in and all of the sudden you see that your position is gone (in the case of setting a hard stop loss). You’ll most likely notice that your stop loss got slipped by xx-amount of points. You might blame the broker but what actually happened is explainable.
The prices on the charts are handed to the broker by the market and presented to you as they happen. Let’s imagine you had an open buy position at 12.100 and your SL was set at 12.080. When the news was released, the volume and volatility moved the price so fast that the price, which the broker received from the market at the release, was 12.070. Technically, it wasn’t possible for the broker to execute at your stop loss. Your position was closed at the next best price, which in this example would be somewhere around 12.070.
At the end of the story, make sure to set stop losses in profit when going into data releases with any open positions or do not trade news as a beginner. Taking unnecessary risks and not following the trading plan makes no sense at all.
Same thing with pending orders. Imagine having a buy order pending at 12.150. As the news is released, price gets pushed so fast that the next price your broker receives is 12.175; 25 points above your initial buy order.
Designed by Byteducate
NEED HELP ?
CONTACT US
You understand and acknowledge that there is a very high degree of risk involved in trading securities and, in particular, in trading forex, futures and options. Please ensure that you fully understand the risks involved. The site is providing educational content which will provide you with an indepth knowledge of the market. This site is in no way providing any investment, financial, tax, or legal advisory and do not purport to provide personalized investment, financial, tax, or legal advice in any form. None of the provided information does recommend the purchase of particular securities, nor does the provider promise or guarantee any particular results. The provider assumes no responsibility or liability for your trading and investment results, and you agree to hold the provider harmless for any such results or losses. It is up to you as a trader to make your own judgement using your own analysis.